This function creates a ggplot2 continuous y-axis scale with breaks at the first day of each month, and labels corresponding to those dates. It is useful for plots where the y-axis represents months.
scale_y_month(...)Value
A ggplot2 scale object for the y-axis.
Examples
data <- data.frame(
date = seq(as.Date("2023-01-01"), as.Date("2023-12-31"), by = "day"),
value = rnorm(365)
)
library(ggplot2)
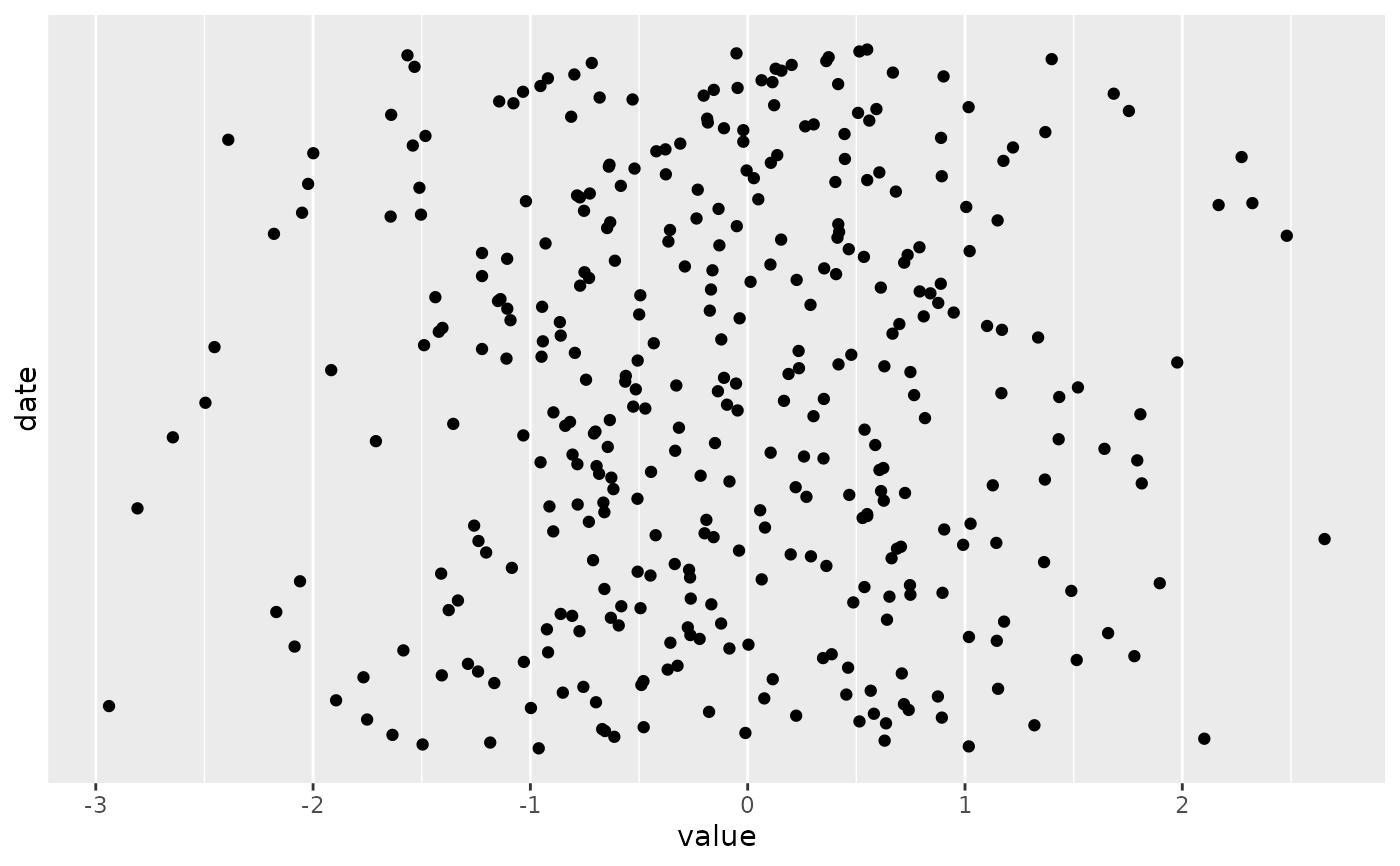
ggplot(data, aes(x = value, y = date)) +
geom_point() +
scale_y_month()